
Researchers have been able to analyze the growth of the entire population on Earth since the beginning of the Common Era (AD anno Domini) when the planet was home to around 300 million people.
Due to the rapid development of medicine and agriculture, as well as improved living conditions, since then the number of people has constantly grown. Moreover, researchers do not anticipate this growth coming to an end.
However, based on its study of information provided by the United Nations, the Pew Research Center forecasts that by the end of this century, despite the population growth, the rate of increase is expected to drop to 0.1% compared to 1.05% in 2020 owing in large part to falling fertility rates around the world.
Global population statistics
- In 1950 there were 2.53 billion people living on Earth and by 2021 this number had tripled to reach 7.9 billion
- From 1959 to 1999 there was a 100% increase from 3 to 6 billion people
- Today, experts anticipate that in another 40 years (from 1999 to 2037) the number of people will rise by 50% and reach 9 billion
- The annual mortality rates show a continuous decrease. Moreover, the median age (which is the age that divides the total population into two identical numbers, that is – half of the people on earth are younger and the other half, older) has risen over the last few decades from 24 years at the end of the 20th century up to 30.9 today
- By the summer of 2021, Asia was home to 59% of all the people on the planet
- The world’s population is currently registering an annual increase of 1.03% (or around 80 million people).
- By 2100 global population will reach 11.2 billion.
2021 global population distribution statistics
Asia is home to more than half of the world’s population with China ranking first being home to around 1.4 billion people.
Fig.1. TOP-20 nations with largest populations, 2021
Source: Worldometers.info
Population distribution by continent
Fig.2.The total world population: 7.8 billion
Source: Statista.com
Nations with the fastest population growth
The population growth rate compares the average yearly percentage difference in populations as a result of an excess (or shortfall) of births over deaths and the difference between migrants entering and departing a country. This rate could be either positive or negative.
According to the World Factbook, maintained by the US Central Intelligence Agency (CIA), in 2021 Africa held the top position in terms of the number of countries with the highest annual population growth rate. South Sudan had the highest population growth rate – 5.06% per year while, on the other hand, the Cook Islands had the highest population fall (2.46%) in comparison to 2020 (meaning that the country’s population decreased by 2.46% in one year).
Source: CIA World Factbook
Global population forecasts
The highest annual growth rate in history was registered in the late 1960s when the figures showed an average +2% growth every year although the pace of growth has since consistently decreased.
The data provided by the United Nations Department of Economic and Social Affairs shows that by the end of the century the number of people living on planet Earth will reach 10.9 billion, with the annual growth rate not exceeding 0.1%.
Researchers forecast that over the next 80 years Africa’s population will increase from 1.3 billion to 4.3 billion with most of these gains expected to occur in sub-Saharan Africa which, unfortunately, is the least developed region in the world.
Fig.3. Global population annual growth forecasts
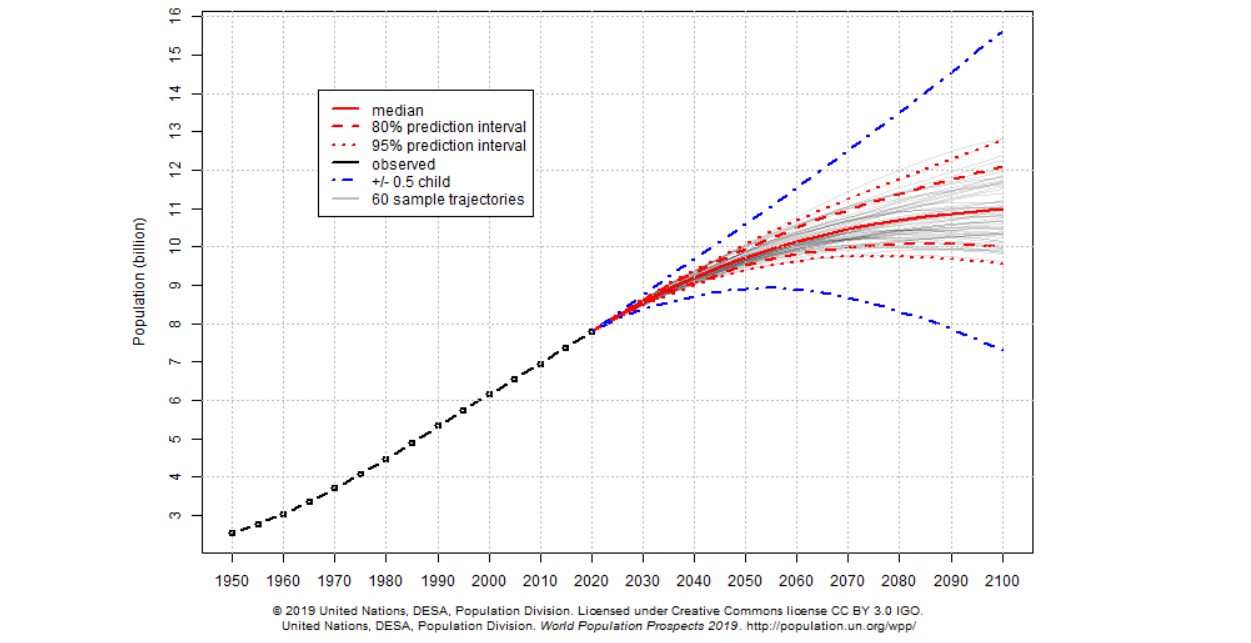
Source: UN
Fig.4. Countries with the largest population and their growth forecasts (million people)
Source: Pew Research Center
Aging population statistics
- By 2050, around 22% of all people will be aged 60+, a 10% increase compared to today’s data
- In 2020, around 20% of people in the European Union (EU) were aged 65 and over
- By 2100, the EU will be home to around 15% of people aged 80 which is an almost 10% increase compared to the current level (5.9%)
- Most of the people aged 65 and over today live in Asia and Europe. The biggest share of elderly people is in Japan with 28% and Italy, in Europe, with 23%
- China leads in terms of the total number of elderly people – 166.3 million
- According to the World Health Organization (WHO), by 2050 the number of people aged 60+ will reach 2.1 billion which is a 50% increase compared to the current level of 1.4 billion
- WHO also predicts that by 2050 the number of people aged 80 and over will triple to reach 426 million
Fig.5.Top 10 nations with the highest number of elderly people
Source: PRB.org
The data available today shows that due to the advances made in the fields of medicine and agriculture over the years, the population is expected to grow at least until the end of this century, reaching almost 11 billion people. At the same time, the forecasts show that by 2100 the annual growth rate will register a significant decrease, reaching 0.1% compared to the current 1.05%, with the highest population growth rate being registered in Africa’s sub-Saharan region. The number of people over 60 years old continues to increase and by 2050 will reach 2.1 billion, with China having the highest number of elderly people.
